Data on the Council’s activity during 2019
The Council of Transparency and Good Governance, for the fifth year, is accountable to the citizens for its activity. The main data of the Council refer to the resolutions on claims of both the State and the Autonomous Communities with which it has signed an agreement. An important part of our activity also relates to consultations on matters of transparency and law enforcement. Below are the data for the year 2019.
Total Council Entries
| Activity (entry) | Year 2019 | Year 2019 (in %) | Cumulative 2015-2019 | Cumulative (in %) |
|---|---|---|---|---|
|
Complaints
|
1,780 |
47.50%
|
5,592 |
49.05%
|
|
Complaints
|
81
|
2.16%
|
308
|
2.70%
|
|
Complaints and suggestions
|
11
|
0.29%
|
61
|
0.54%
|
|
Consultations on implementation of the Act
|
98
|
2.62%
|
552
|
4.84%
|
|
Information to the citizen
|
1,777 |
47.42%
|
4.888 |
42.87%
|
|
Total entries |
3,747 |
100%
|
11.401 |
100%
|
-
Activity (entry)
-
Complaints
-
Year 2019
1,780
-
Year 2019 (in %)
47.50% -
Cumulative 2015-2019
5,592
-
Cumulative (in %)
49.05%
-
-
Activity (entry)
-
Complaints
-
Year 2019
81 -
Year 2019 (in %)
2.16% -
Cumulative 2015-2019
308 -
Cumulative (in %)
2.70%
-
-
Activity (entry)
-
Complaints and suggestions
-
Year 2019
11 -
Year 2019 (in %)
0.29% -
Cumulative 2015-2019
61 -
Cumulative (in %)
0.54%
-
-
Activity (entry)
-
Consultations on implementation of the Act
-
Year 2019
98 -
Year 2019 (in %)
2.62% -
Cumulative 2015-2019
552 -
Cumulative (in %)
4.84%
-
-
Activity (entry)
-
Information to the citizen
-
Year 2019
1,777
-
Year 2019 (in %)
47.42% -
Cumulative 2015-2019
4.888
-
Cumulative (in %)
42.87%
-
-
Activity (entry)
-
Total entries
-
Year 2019
3,747
-
Year 2019 (in %)
100% -
Cumulative 2015-2019
11.401
-
Cumulative (in %)
100%
-
Tickets to the Council by months (2019)
| Month | Complaints | Complaints | Complaints and suggestions | Consultations on implementation of the Act | Information to citizens | Total entries |
|---|---|---|---|---|---|---|
|
jan. |
160 |
3 |
0 |
6 |
156 |
325 |
|
feb. |
146 |
5 |
0 |
15 |
154 |
320 |
|
mar. |
132 |
4 |
1 |
6 |
184 |
327 |
|
apr. |
137 |
3 |
4 |
9 |
134 |
287 |
|
may |
198 |
10 |
0 |
7 |
155 |
370 |
|
jun. |
130 |
8 |
2 |
4 |
159 |
303 |
|
jul. |
154 |
5 |
0 |
7 |
146 |
312 |
|
aug. |
135 |
1 |
0 |
6 |
93 |
235 |
|
Sept. |
147 |
5 |
1 |
11 |
150 |
314 |
|
oct. |
141 |
14 |
0 |
6 |
167 |
328 |
|
nov. |
168 |
14 |
3 |
11 |
154 |
350 |
|
dec. |
132 |
9 |
0 |
10 |
125 |
276 |
|
Total |
1,780 |
81 |
11 |
98 |
1,777 |
3,747 |
-
Month
-
jan.
-
Complaints
160
-
Complaints
3
-
Complaints and suggestions
0
-
Consultations on implementation of the Act
6
-
Information to citizens
156
-
Total entries
325
-
-
Month
-
feb.
-
Complaints
146
-
Complaints
5
-
Complaints and suggestions
0
-
Consultations on implementation of the Act
15
-
Information to citizens
154
-
Total entries
320
-
-
Month
-
mar.
-
Complaints
132
-
Complaints
4
-
Complaints and suggestions
1
-
Consultations on implementation of the Act
6
-
Information to citizens
184
-
Total entries
327
-
-
Month
-
apr.
-
Complaints
137
-
Complaints
3
-
Complaints and suggestions
4
-
Consultations on implementation of the Act
9
-
Information to citizens
134
-
Total entries
287
-
-
Month
-
may
-
Complaints
198
-
Complaints
10
-
Complaints and suggestions
0
-
Consultations on implementation of the Act
7
-
Information to citizens
155
-
Total entries
370
-
-
Month
-
jun.
-
Complaints
130
-
Complaints
8
-
Complaints and suggestions
2
-
Consultations on implementation of the Act
4
-
Information to citizens
159
-
Total entries
303
-
-
Month
-
jul.
-
Complaints
154
-
Complaints
5
-
Complaints and suggestions
0
-
Consultations on implementation of the Act
7
-
Information to citizens
146
-
Total entries
312
-
-
Month
-
aug.
-
Complaints
135
-
Complaints
1
-
Complaints and suggestions
0
-
Consultations on implementation of the Act
6
-
Information to citizens
93
-
Total entries
235
-
-
Month
-
Sept.
-
Complaints
147
-
Complaints
5
-
Complaints and suggestions
1
-
Consultations on implementation of the Act
11
-
Information to citizens
150
-
Total entries
314
-
-
Month
-
oct.
-
Complaints
141
-
Complaints
14
-
Complaints and suggestions
0
-
Consultations on implementation of the Act
6
-
Information to citizens
167
-
Total entries
328
-
-
Month
-
nov.
-
Complaints
168
-
Complaints
14
-
Complaints and suggestions
3
-
Consultations on implementation of the Act
11
-
Information to citizens
154
-
Total entries
350
-
-
Month
-
dec.
-
Complaints
132
-
Complaints
9
-
Complaints and suggestions
0
-
Consultations on implementation of the Act
10
-
Information to citizens
125
-
Total entries
276
-
-
Month
-
Total
-
Complaints
1,780
-
Complaints
81
-
Complaints and suggestions
11
-
Consultations on implementation of the Act
98
-
Information to citizens
1,777
-
Total entries
3,747
-
Total claims (cumulative)
| Total | 2015 | 2016 | 2017 | 2018 | 2019 |
|---|---|---|---|---|---|
|
5,592 |
517 |
890 |
1.067 |
1,338 |
1,780 |
-
Total
-
5,592
-
2015
517
-
2016
890
-
2017
1.067
-
2018
1,338
-
2019
1,780
-
Total claims by type of Administration
| Admon. | 2015 | 2016 | 2017 | 2018 | 2019 | Total |
|---|---|---|---|---|---|---|
|
Admon. state-owned |
517 |
557 |
557 |
755 |
927 |
3.313 |
|
Admnes. Territorial |
--- |
333 |
510 |
583 |
853 |
2.279 |
|
Total |
517 |
890 |
1.067 |
1,338 |
1,780 |
5,592 |
-
Admon.
-
Admon. state-owned
-
2015
517
-
2016
557
-
2017
557
-
2018
755
-
2019
927
-
Total
3.313
-
-
Admon.
-
Admnes. Territorial
-
2015
---
-
2016
333
-
2017
510
-
2018
583
-
2019
853
-
Total
2.279
-
-
Admon.
-
Total
-
2015
517
-
2016
890
-
2017
1.067
-
2018
1,338
-
2019
1,780
-
Total
5,592
-
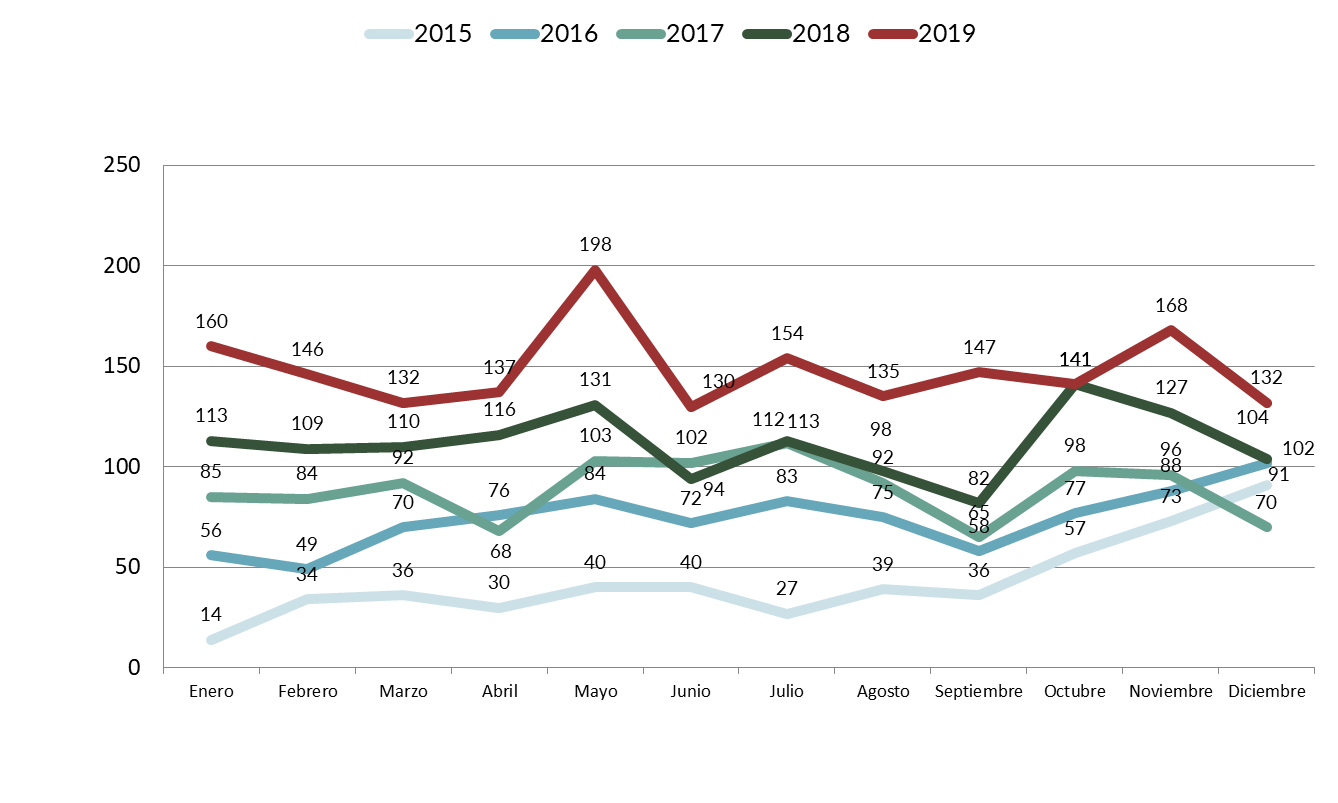
Total claims received during 2019 by month
| Recl. | jan. | feb. | mar. | apr. | may | jun. | jul. | aug. | Sept. | oct. | nov. | dec. | Total |
|---|---|---|---|---|---|---|---|---|---|---|---|---|---|
|
AE |
69
|
75
|
82
|
66
|
88
|
80
|
80
|
84
|
71
|
65
|
99
|
68
|
927
|
|
CCAA regional |
91
|
71
|
50
|
71
|
110
|
50
|
74
|
51
|
76
|
76
|
69
|
64
|
853
|
|
Total |
160
|
146
|
132
|
137
|
198
|
130
|
154
|
135
|
147
|
141
|
168
|
132
|
1,780 |
-
Recl.
-
AE
-
jan.
69 -
feb.
75 -
mar.
82 -
apr.
66 -
may
88 -
jun.
80 -
jul.
80 -
aug.
84 -
Sept.
71 -
oct.
65 -
nov.
99 -
dec.
68 -
Total
927
-
-
Recl.
-
CCAA regional
-
jan.
91 -
feb.
71 -
mar.
50 -
apr.
71 -
may
110 -
jun.
50 -
jul.
74 -
aug.
51 -
Sept.
76 -
oct.
76 -
nov.
69 -
dec.
64 -
Total
853
-
-
Recl.
-
Total
-
jan.
160 -
feb.
146 -
mar.
132 -
apr.
137 -
may
198 -
jun.
130 -
jul.
154 -
aug.
135 -
Sept.
147 -
oct.
141 -
nov.
168 -
dec.
132 -
Total
1,780
-
Claims by Autonomous Communities (with agreement with the Council)
| Month | Madrid | Castile-La Mancha | Canta Bria | Extre-madura | Asturias | La Rioja | Ceuta | Melilla | Total |
|---|---|---|---|---|---|---|---|---|---|
|
Jan. |
26 |
17 |
11 |
8 |
16 |
1 |
0 |
12 |
91 |
|
Feb. |
31 |
13 |
4 |
6 |
8 |
1 |
0 |
8 |
71 |
|
Mar. |
28 |
7 |
5 |
3 |
4 |
1 |
0 |
2 |
50 |
|
Apr. |
38 |
13 |
7 |
2 |
4 |
6 |
0 |
1 |
71 |
|
May. |
67 |
15 |
2 |
9 |
9 |
1 |
3 |
0 |
106 |
|
Jun. |
32 |
7 |
1 |
5 |
4 |
0 |
0 |
1 |
50 |
|
Jul. |
38 |
9 |
4 |
14 |
6 |
1 |
0 |
1 |
73 |
|
Aug. |
23 |
2 |
4 |
10 |
10 |
1 |
0 |
0 |
50 |
|
Sept. |
28 |
9 |
6 |
14 |
8 |
11 |
0 |
0 |
76 |
|
Oct. |
27 |
12 |
15 |
6 |
4 |
0 |
0 |
12 |
76 |
|
Nov. |
34 |
16 |
7 |
6 |
3 |
3 |
0 |
0 |
69 |
|
Dec. |
37 |
15 |
4 |
1 |
6 |
1 |
0 |
0 |
64 |
|
Total 2019 |
409 |
135 |
70 |
84 |
82 |
27 |
3 |
37 |
847 |
|
(2016-2019) |
935 |
388 |
248 |
222 |
195 |
59 |
56 |
62 |
2,165 |
-
Month
-
Jan.
-
Madrid
26
-
Castile-La Mancha
17
-
Canta Bria
11
-
Extre-madura
8
-
Asturias
16
-
La Rioja
1
-
Ceuta
0
-
Melilla
12
-
Total
91
-
-
Month
-
Feb.
-
Madrid
31
-
Castile-La Mancha
13
-
Canta Bria
4
-
Extre-madura
6
-
Asturias
8
-
La Rioja
1
-
Ceuta
0
-
Melilla
8
-
Total
71
-
-
Month
-
Mar.
-
Madrid
28
-
Castile-La Mancha
7
-
Canta Bria
5
-
Extre-madura
3
-
Asturias
4
-
La Rioja
1
-
Ceuta
0
-
Melilla
2
-
Total
50
-
-
Month
-
Apr.
-
Madrid
38
-
Castile-La Mancha
13
-
Canta Bria
7
-
Extre-madura
2
-
Asturias
4
-
La Rioja
6
-
Ceuta
0
-
Melilla
1
-
Total
71
-
-
Month
-
May.
-
Madrid
67
-
Castile-La Mancha
15
-
Canta Bria
2
-
Extre-madura
9
-
Asturias
9
-
La Rioja
1
-
Ceuta
3
-
Melilla
0
-
Total
106
-
-
Month
-
Jun.
-
Madrid
32
-
Castile-La Mancha
7
-
Canta Bria
1
-
Extre-madura
5
-
Asturias
4
-
La Rioja
0
-
Ceuta
0
-
Melilla
1
-
Total
50
-
-
Month
-
Jul.
-
Madrid
38
-
Castile-La Mancha
9
-
Canta Bria
4
-
Extre-madura
14
-
Asturias
6
-
La Rioja
1
-
Ceuta
0
-
Melilla
1
-
Total
73
-
-
Month
-
Aug.
-
Madrid
23
-
Castile-La Mancha
2
-
Canta Bria
4
-
Extre-madura
10
-
Asturias
10
-
La Rioja
1
-
Ceuta
0
-
Melilla
0
-
Total
50
-
-
Month
-
Sept.
-
Madrid
28
-
Castile-La Mancha
9
-
Canta Bria
6
-
Extre-madura
14
-
Asturias
8
-
La Rioja
11
-
Ceuta
0
-
Melilla
0
-
Total
76
-
-
Month
-
Oct.
-
Madrid
27
-
Castile-La Mancha
12
-
Canta Bria
15
-
Extre-madura
6
-
Asturias
4
-
La Rioja
0
-
Ceuta
0
-
Melilla
12
-
Total
76
-
-
Month
-
Nov.
-
Madrid
34
-
Castile-La Mancha
16
-
Canta Bria
7
-
Extre-madura
6
-
Asturias
3
-
La Rioja
3
-
Ceuta
0
-
Melilla
0
-
Total
69
-
-
Month
-
Dec.
-
Madrid
37
-
Castile-La Mancha
15
-
Canta Bria
4
-
Extre-madura
1
-
Asturias
6
-
La Rioja
1
-
Ceuta
0
-
Melilla
0
-
Total
64
-
-
Month
-
Total
2019
-
Madrid
409
-
Castile-La Mancha
135
-
Canta Bria
70
-
Extre-madura
84
-
Asturias
82
-
La Rioja
27
-
Ceuta
3
-
Melilla
37
-
Total
847
-
-
Month
-
(2016-2019)
-
Madrid
935
-
Castile-La Mancha
388
-
Canta Bria
248
-
Extre-madura
222
-
Asturias
195
-
La Rioja
59
-
Ceuta
56
-
Melilla
62
-
Total
2,165
-
Resolutions to the claims: accumulated (status as of December 31, 2019)
| Total resolutions | Resolutions of the EA (State Administration) | Resolutions of the AATT (Territorial Administrations) | Totals |
|---|---|---|---|
|
Resolved (inadmissible+admitted+archived) |
3.117 |
2.082 |
5,199 |
|
Inadmissible |
573 |
527 |
1100 |
|
Admitted |
2.407 |
1.401 |
3.808 |
|
Archived |
137 |
154 |
297 |
|
In progress (Pending resolution) |
196 |
197 |
393 |
|
TOTAL (Resolved + in processing) |
3.313 |
2.279 |
5,592 |
-
Total resolutions
-
Resolved (inadmissible+admitted+archived)
-
Resolutions of the EA (State Administration)
3.117
-
Resolutions of the AATT (Territorial Administrations)
2.082
-
Totals
5,199
-
-
Total resolutions
-
Inadmissible
-
Resolutions of the EA (State Administration)
573
-
Resolutions of the AATT (Territorial Administrations)
527
-
Totals
1100
-
-
Total resolutions
-
Admitted
-
Resolutions of the EA (State Administration)
2.407
-
Resolutions of the AATT (Territorial Administrations)
1.401
-
Totals
3.808
-
-
Total resolutions
-
Archived
-
Resolutions of the EA (State Administration)
137
-
Resolutions of the AATT (Territorial Administrations)
154
-
Totals
297
-
-
Total resolutions
-
In progress (Pending resolution)
-
Resolutions of the EA (State Administration)
196
-
Resolutions of the AATT (Territorial Administrations)
197
-
Totals
393
-
-
Total resolutions
-
TOTAL (Resolved + in processing)
-
Resolutions of the EA (State Administration)
3.313
-
Resolutions of the AATT (Territorial Administrations)
2.279
-
Totals
5,592
-
Resolutions admitted as of December 31 (accumulated 2015-2019)
| Sense of the resolution | EA (No.) | EA (%) | AATT (no.) | AATT (%) | Total | Total (%) |
|---|---|---|---|---|---|---|
|
Estimates* |
1,333 |
55.38% |
1.006 |
71.81% |
2,339 |
61.42% |
|
Dismissed |
1,038 |
43.12% |
360 |
25.70% |
1.398 |
36.71% |
|
Retract performances/ suspended |
36 |
1.50% |
35 |
2.50% |
71 |
1.86% |
|
Total |
2.407 |
100% |
1.401 |
100% |
3.808 |
100% |
-
Sense of the resolution
-
Estimates*
-
EA (No.)
1,333
-
EA (%)
55.38%
-
AATT (no.)
1.006
-
AATT (%)
71.81%
-
Total
2,339
-
Total (%)
61.42%
-
-
Sense of the resolution
-
Dismissed
-
EA (No.)
1,038
-
EA (%)
43.12%
-
AATT (no.)
360
-
AATT (%)
25.70%
-
Total
1.398
-
Total (%)
36.71%
-
-
Sense of the resolution
-
Retract
performances/
suspended
-
EA (No.)
36
-
EA (%)
1.50%
-
AATT (no.)
35
-
AATT (%)
2.50%
-
Total
71
-
Total (%)
1.86%
-
-
Sense of the resolution
-
Total
-
EA (No.)
2.407
-
EA (%)
100%
-
AATT (no.)
1.401
-
AATT (%)
100%
-
Total
3.808
-
Total (%)
100%
-
* Estimates are included for formal reasons
Judicial remedies against Council resolutions of the first half of the year
| Years | AE | AATT | Total |
|---|---|---|---|
|
2019
|
52
|
25
|
77
|
|
2018
|
41
|
6
|
47
|
|
2017
|
44
|
8
|
52
|
|
2016
|
27
|
--
|
27
|
|
2015
|
5
|
--
|
5
|
|
TOTAL
|
169
|
39
|
208
|
-
Years
-
2019
-
AE
52 -
AATT
25 -
Total
77
-
-
Years
-
2018
-
AE
41 -
AATT
6 -
Total
47
-
-
Years
-
2017
-
AE
44 -
AATT
8 -
Total
52
-
-
Years
-
2016
-
AE
27 -
AATT
-- -
Total
27
-
-
Years
-
2015
-
AE
5 -
AATT
-- -
Total
5
-
-
Years
-
TOTAL
-
AE
169 -
AATT
39 -
Total
208
-